MR images from our studies
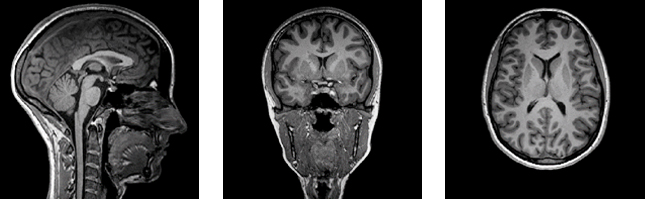
A high resolution T1-weighted image. The left image shows a sagittal view of the brain (looking from the side), the middle panel shows a coronal view (looking from the front), and the right panel shows an axial view (looking from above) of the brain. This provides excellent information on the volume of brain structures, as well as serving as the base of many other analysis processes.

A 3D model of the brain rendered from the high resolution structural (T1-weighted) image.

A 2D proton density-weighted image acquired perpendicular to the temporal lobes. This image is used to investigate the hippocampus, an area of the brain involved in memory.
Blood Flow MRI

”Arterial spin labelling” is used to quantitatively measure perfusion (blood flow). Here, perfusion data has been colour-coded and overlaid on a high-resolution structural scan. Red indicates areas of high flow and blue indicates areas of low flow.
Diffusion MRI
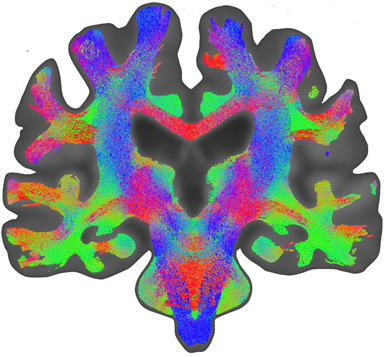 An example of diffusion MRI. We have used High Angular Resolution Diffusion Imaging (HARDI) to trace out the white matter tracts in the brain. On the left, we see coronal view of the reconstructed cortico-motor tracts (in blue), connecting the spinal cord (at the bottom of the image) and the motor cortex (top of the image). Red indicates fibres traveling in the right-left direction, while green indicates fibres in the anterior-posterior direction (in-out of the image). These images were created using MRTrix software (www.mrtix.org).
Functional MRI

Functional MRI allows us to measure the most active areas of the brain in real-time. Here, areas of red indicate areas of increased activity when the participant was viewing a flashing checkerboard relative to focusing on a cross. Activated areas correspond to the occipital cortex, an area of the brain highly involved in vision.
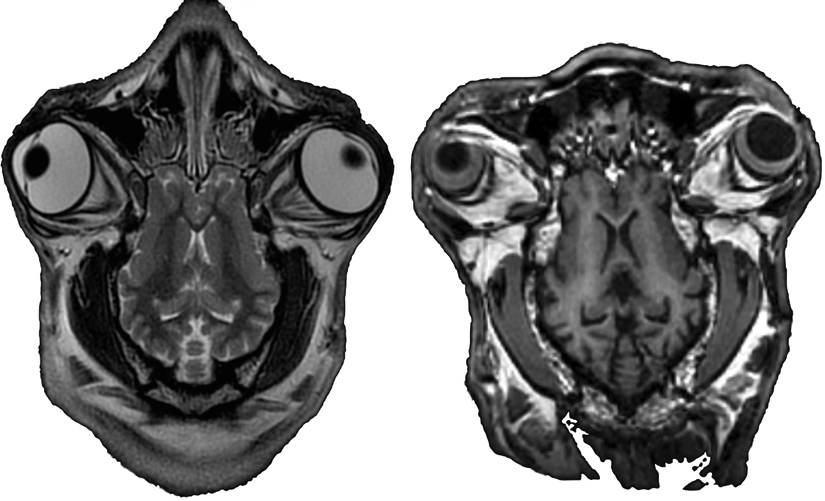
We also scan non-humans! Here are some images of sheep brains.
PET Images
Amyloid PET
Amyloid PET allows in vivo imaging of the deposition of amyloid protein in the brain. Red indicates high accumulation of amyloid. The left image shows a person in the normal range (whose amyloid deposition is limited to the white matter). The person on the right shows an abnormally high uptake, as deposition occurs throughout the brain, including cortical grey matter. Such a pattern is indicative of dementia.
Glucose PET

An axial image of glucose metabolism. Areas of red indicate high metabolism, while blue indicates lower glucose consumption.